
Table of Contents:
TL;DR
This post shows you how to implement Job Offloading Pattern using an a pipeline built with System.Threading.Channels
Source code: https://github.com/NikiforovAll/channels-composition-and-otel
Introduction
The job offloading pattern is a technique for improving the performance and responsiveness of a system by delegating tasks to be completed outside of the main thread or process. This frees up the main thread to focus on critical tasks and keeps the user interface responsive.
Consider a Web API that receives requests to perform data-intensive operations, such as generating reports from large datasets. If these operations are performed synchronously within the API request, it could lead to long response times and potentially timeout errors. This would result in a poor user experience and could also impact the scalability of the API.
By using the job offloading pattern, these data-intensive operations can be offloaded to a background worker. When a request is received, the API can quickly respond with a message indicating that the operation is in progress. The actual operation is then performed in the background, without blocking the API from handling other requests.
Once the operation is complete, the result can be stored in a location from where the client can retrieve it, such as a database or a cloud storage. The client can periodically check for the result or the API can provide a notification mechanism to inform the client when the operation is complete.
This approach not only improves the responsiveness of the API, but also allows it to scale better by freeing up resources to handle more incoming requests while the background workers are performing the data-intensive operations.
There are several benefits to using the job offloading pattern:
- Improved responsiveness: By offloading long-running or resource-intensive tasks, the main thread is free to handle user interactions and keep the application responsive.
- Increased scalability: Offloading jobs allows the system to distribute workload across multiple workers or machines, improving scalability as demand increases.
- Enhanced reliability: If a job fails, it can be retried without impacting the main application.
Here are some common ways to implement job offloading:
- Background Jobs 🎯(this article): These are tasks that are submitted to a queue and processed asynchronously by a background worker. This is a popular approach for tasks like sending emails, processing images, or updating databases.
- Work Queues: A work queue is a data structure that stores jobs to be processed. The worker process retrieves jobs from the queue and executes them. There are various message queueing systems available to implement work queues.
- Outbox Pattern: This pattern involves storing job information in a database table before it’s submitted to a queue. This ensures data consistency and allows for retries in case of queue failures.
In this article we will focus on Background Jobs because this option is suitable for many scenarios and doesn’t require additional dependencies like databases, message queues, etc.
Defining Pipeline
As discussed in my previous post we can make use of System.Threading.Channels to build pipelines.
Assume we have a pipeline like following:
Take a look at code below, it shows some concepts like payload transformation, accessing a DI container and concurrent processing:
public class ProcessorChannel : IBackgroundProcessor
{
    private readonly Channel<Payload> _pipeline;
    private const int MinDelay = 500;
    private const int MaxDelay = 1000;

    public ProcessorChannel(
        IServiceProvider serviceProvider,
        IOptions<ProcessorChannelSettings> processorOptions
    )
    {
        var options = processorOptions.Value;
        _pipeline = Channel.CreateBounded<Payload>(options.Capacity);

        Writer = _pipeline;
        Reader = _pipeline
            .Pipe(
                payload =>
                    InitPipeline(payload, options.UseUnifiedSpanForAllPipelines, serviceProvider),
                options.Capacity
            )
            .PipeAsync(
                maxConcurrency: options.Step1MaxConcurrency,
                Step1,
                capacity: options.Step1Capacity
            )
            .PipeAsync(
                maxConcurrency: options.Step2MaxConcurrency,
                Step2,
                capacity: options.Step2Capacity
            )
            .Pipe(FinishPipeline);
    }

    public async ValueTask QueueBackgroundWorkItemAsync(
        Payload payload,
        CancellationToken cancellationToken = default
    )
    {
        ArgumentNullException.ThrowIfNull(payload);

        await Writer.WriteAsync(payload, cancellationToken);
    }

    private static PayloadWithScope<Payload> InitPipeline(
        Payload payload,
        bool useUnifiedSpanForAllPipelines,
        IServiceProvider serviceProvider
    )
    {
        var context = new PayloadWithScope<Payload>(
            payload,
            serviceProvider.CreateScope()
        );

        return context;
    }

    private PayloadResult FinishPipeline(PayloadWithScope<PayloadResult> context)
    {
        context.ServiceScope?.Dispose();

        return context.Payload;
    }

    private async ValueTask<PayloadWithScope<Payload2>> Step1(PayloadWithScope<Payload> context)
    {
        var timeProvider = context.GetRequiredService<TimeProvider>();

        var delay = Random.Shared.Next(MinDelay, MaxDelay);
        await Task.Delay(delay);

        return new(
            new(context.Payload.Name, timeProvider.GetUtcNow(), $"Waited {delay} ms."),
            context.ServiceScope
        );
    }

    private async ValueTask<PayloadWithScope<PayloadResult>> Step2(
        PayloadWithScope<Payload2> context
    )
    {
        var payload = context.Payload;
        var timeProvider = context.GetRequiredService<TimeProvider>();

        var delay = Random.Shared.Next(MinDelay, MaxDelay);
        await Task.Delay(delay);

        return new(
            new(payload.Name, payload.CreatedAt, payload.Message, timeProvider.GetUtcNow()),
            context.ServiceScope
        );
    }

    public ChannelWriter<Payload> Writer { get; }
    public ChannelReader<PayloadResult> Reader { get; }
}
In order to use the pipeline, we can register IBackgroundProcessor:
public interface IBackgroundProcessor
{
    ValueTask QueueBackgroundWorkItemAsync(
        Payload payload,
        CancellationToken cancellationToken = default
    );
}
Here is how DI registration looks like:
var builder = WebApplication.CreateBuilder(args);

builder.Services.AddHostedService<ProcessorBackgroundService>();
builder.Services.AddSingleton<ProcessorChannel>();
builder.Services.AddSingleton<IBackgroundProcessor, ProcessorChannel>();
builder.Services.AddSingleton<TimeProvider>(_ => TimeProvider.System);

builder.Services.AddSingleton<ChannelReader<PayloadResult>>(sp =>
    sp.GetRequiredService<ProcessorChannel>().Reader
);

builder.Services.Configure<ProcessorChannelSettings>(options =>
{
    options.Capacity = 25;
    options.Step1Capacity = 10;
    options.Step1MaxConcurrency = 5;
    options.Step2Capacity = 10;
    options.Step2MaxConcurrency = 2;
});

var app = builder.Build();
Here is how to offload (dispatch) a task to the pipeline from an endpoint:
app.MapPost(
    "/start",
    async (
        [FromBody] Payload payload,
        IBackgroundProcessor writer,
        CancellationToken cancellationToken
    ) =>
    {
        await writer.QueueBackgroundWorkItemAsync(payload, cancellationToken);

        return TypedResults.Ok(new { Success = true });
    }
)
On a receiving end, we have ProcessorBackgroundService:
public class ProcessorBackgroundService(
    ChannelReader<PayloadResult> reader,
    ILogger<ProcessorBackgroundService> logger
) : BackgroundService
{
    protected override async Task ExecuteAsync(CancellationToken stoppingToken)
    {
        await foreach (var _ in reader.ReadAllAsync(stoppingToken))
        {
            logger.LogProcessedByWorker();
        }
    }
}
The processing of item in the pipeline starts based on queue and ProcessorBackgroundService is only used as a receiving end (consumer) to retrieve the results.
Adding OpenTelemetry
OpenTelemetry is a powerful observability framework that helps you understand what happens inside your application’s pipeline. It provides a standardized way to collect, instrument, and export telemetry data, such as metrics, traces, and logs.
By integrating OpenTelemetry into your application, you gain visibility into the internal workings of your code. This visibility allows you to monitor and analyze the performance, behavior, and dependencies of your application components. Here’s how OpenTelemetry helps in understanding the pipeline:
-
Metrics: OpenTelemetry allows you to collect and analyze various metrics, such as CPU usage, memory consumption, request latency, and error rates. These metrics provide insights into the overall health and performance of your application. By monitoring these metrics, you can identify bottlenecks, optimize resource utilization, and detect anomalies.
- Tracing: OpenTelemetry enables distributed tracing, which helps you understand the flow of requests across different services and components in your application. With distributed tracing, you can track the path of a request as it traverses through various microservices, databases, and external dependencies. This helps you identify performance bottlenecks, latency issues, and problematic dependencies. Traces also provide a detailed timeline of events, allowing you to pinpoint the exact location of issues and optimize the critical path.
- Logging: OpenTelemetry allows you to capture and analyze logs from your application. Logs provide valuable information about the execution flow, error messages, and other important events. By aggregating and analyzing logs, you can troubleshoot issues, detect errors, and gain insights into the behavior of your application.
- Context Propagation: OpenTelemetry provides context propagation mechanisms that allow you to pass contextual information, such as request IDs and correlation IDs, across different services and components. This helps in correlating logs, traces, and metrics related to a specific request or transaction, making it easier to understand the end-to-end flow and troubleshoot issues.
❗💡For this blog post I will not explain how to instrument pipelines using OpenTelemetry for the sake of simplicity, but I strongly recommend you taking a look at source code for more details: https://github.com/NikiforovAll/channels-composition-and-otel/tree/main
Demo
dotnet run --project ./src/AppHost
Running single request
Let’s run a single request:
POST /start
Content-Type: application/json

{
    "name": "Task 1"
}
Here is the trace result for an operation:
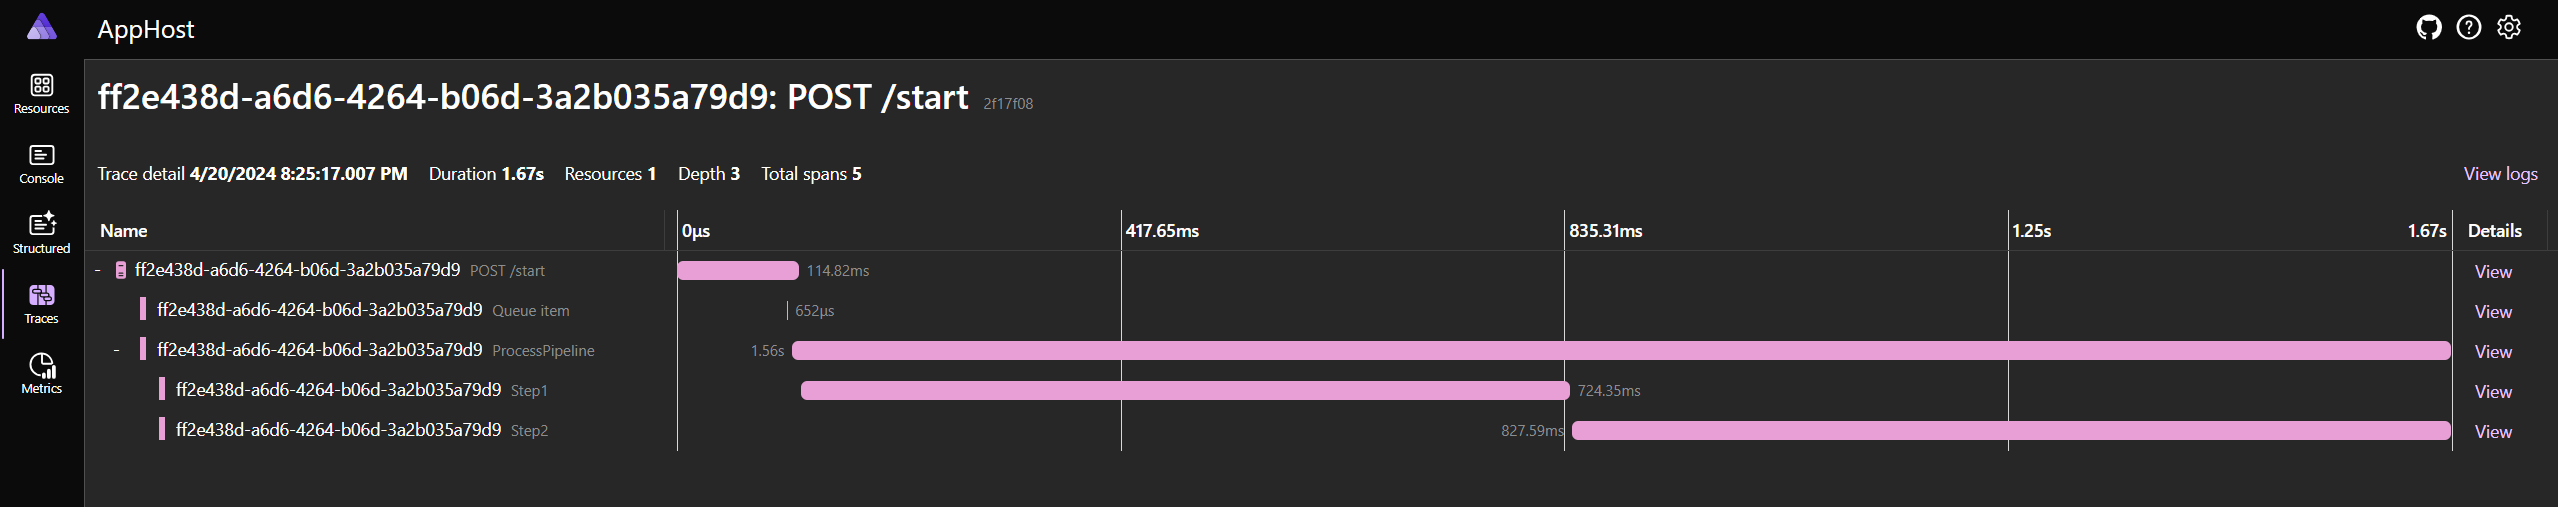
The visualization shows the sequence and timing of each span in the trace, indicating the flow of the request through different components of the service. The longer bars represent spans that took more time to complete, and the gaps between bars indicate idle time or time spent waiting for a response from another service or component.
- Trace ID: ff2e438d-a6d6-4264-b06d-3a2b035a79d9
- Endpoint: POST /start
- Duration: 1.67s
- Depth: 3
- Total Spans: 5
Spans:
- POST /start
- Duration: 114.82ms
- Queue item
- Duration: 652us
- ProcessPipeline
- Duration: 1.56s
- Step1
- Duration: 724.35ms
- Step2
- Duration: 827.59ms
Adding custom metrics and using Bombardier
As mentioned above, I will not show use the details of OpenTelemetry instrumentation in this blog post, but in full-implementation I’ve added a couple of metrics that allows us to inspect how many requests are under processing by the pipeline:
public static class ServiceMetrics
{
    private static Meter _meter = new Meter("MyService.Pipelines");

    public static Counter<int> StartedCounter { get; } =
        _meter.CreateCounter<int>("pipelines.started");

    public static UpDownCounter<int> InProgressCounter { get; } =
        _meter.CreateUpDownCounter<int>("pipelines.in-progress");

    public static UpDownCounter<int> InProgressStep1Counter { get; } =
        _meter.CreateUpDownCounter<int>("pipelines.step1.in-progress");

    public static UpDownCounter<int> InProgressStep2Counter { get; } =
        _meter.CreateUpDownCounter<int>("pipelines.step2.in-progress");
    public static Counter<int> FinishedCounter { get; } =
        _meter.CreateCounter<int>("pipelines.finished");
}
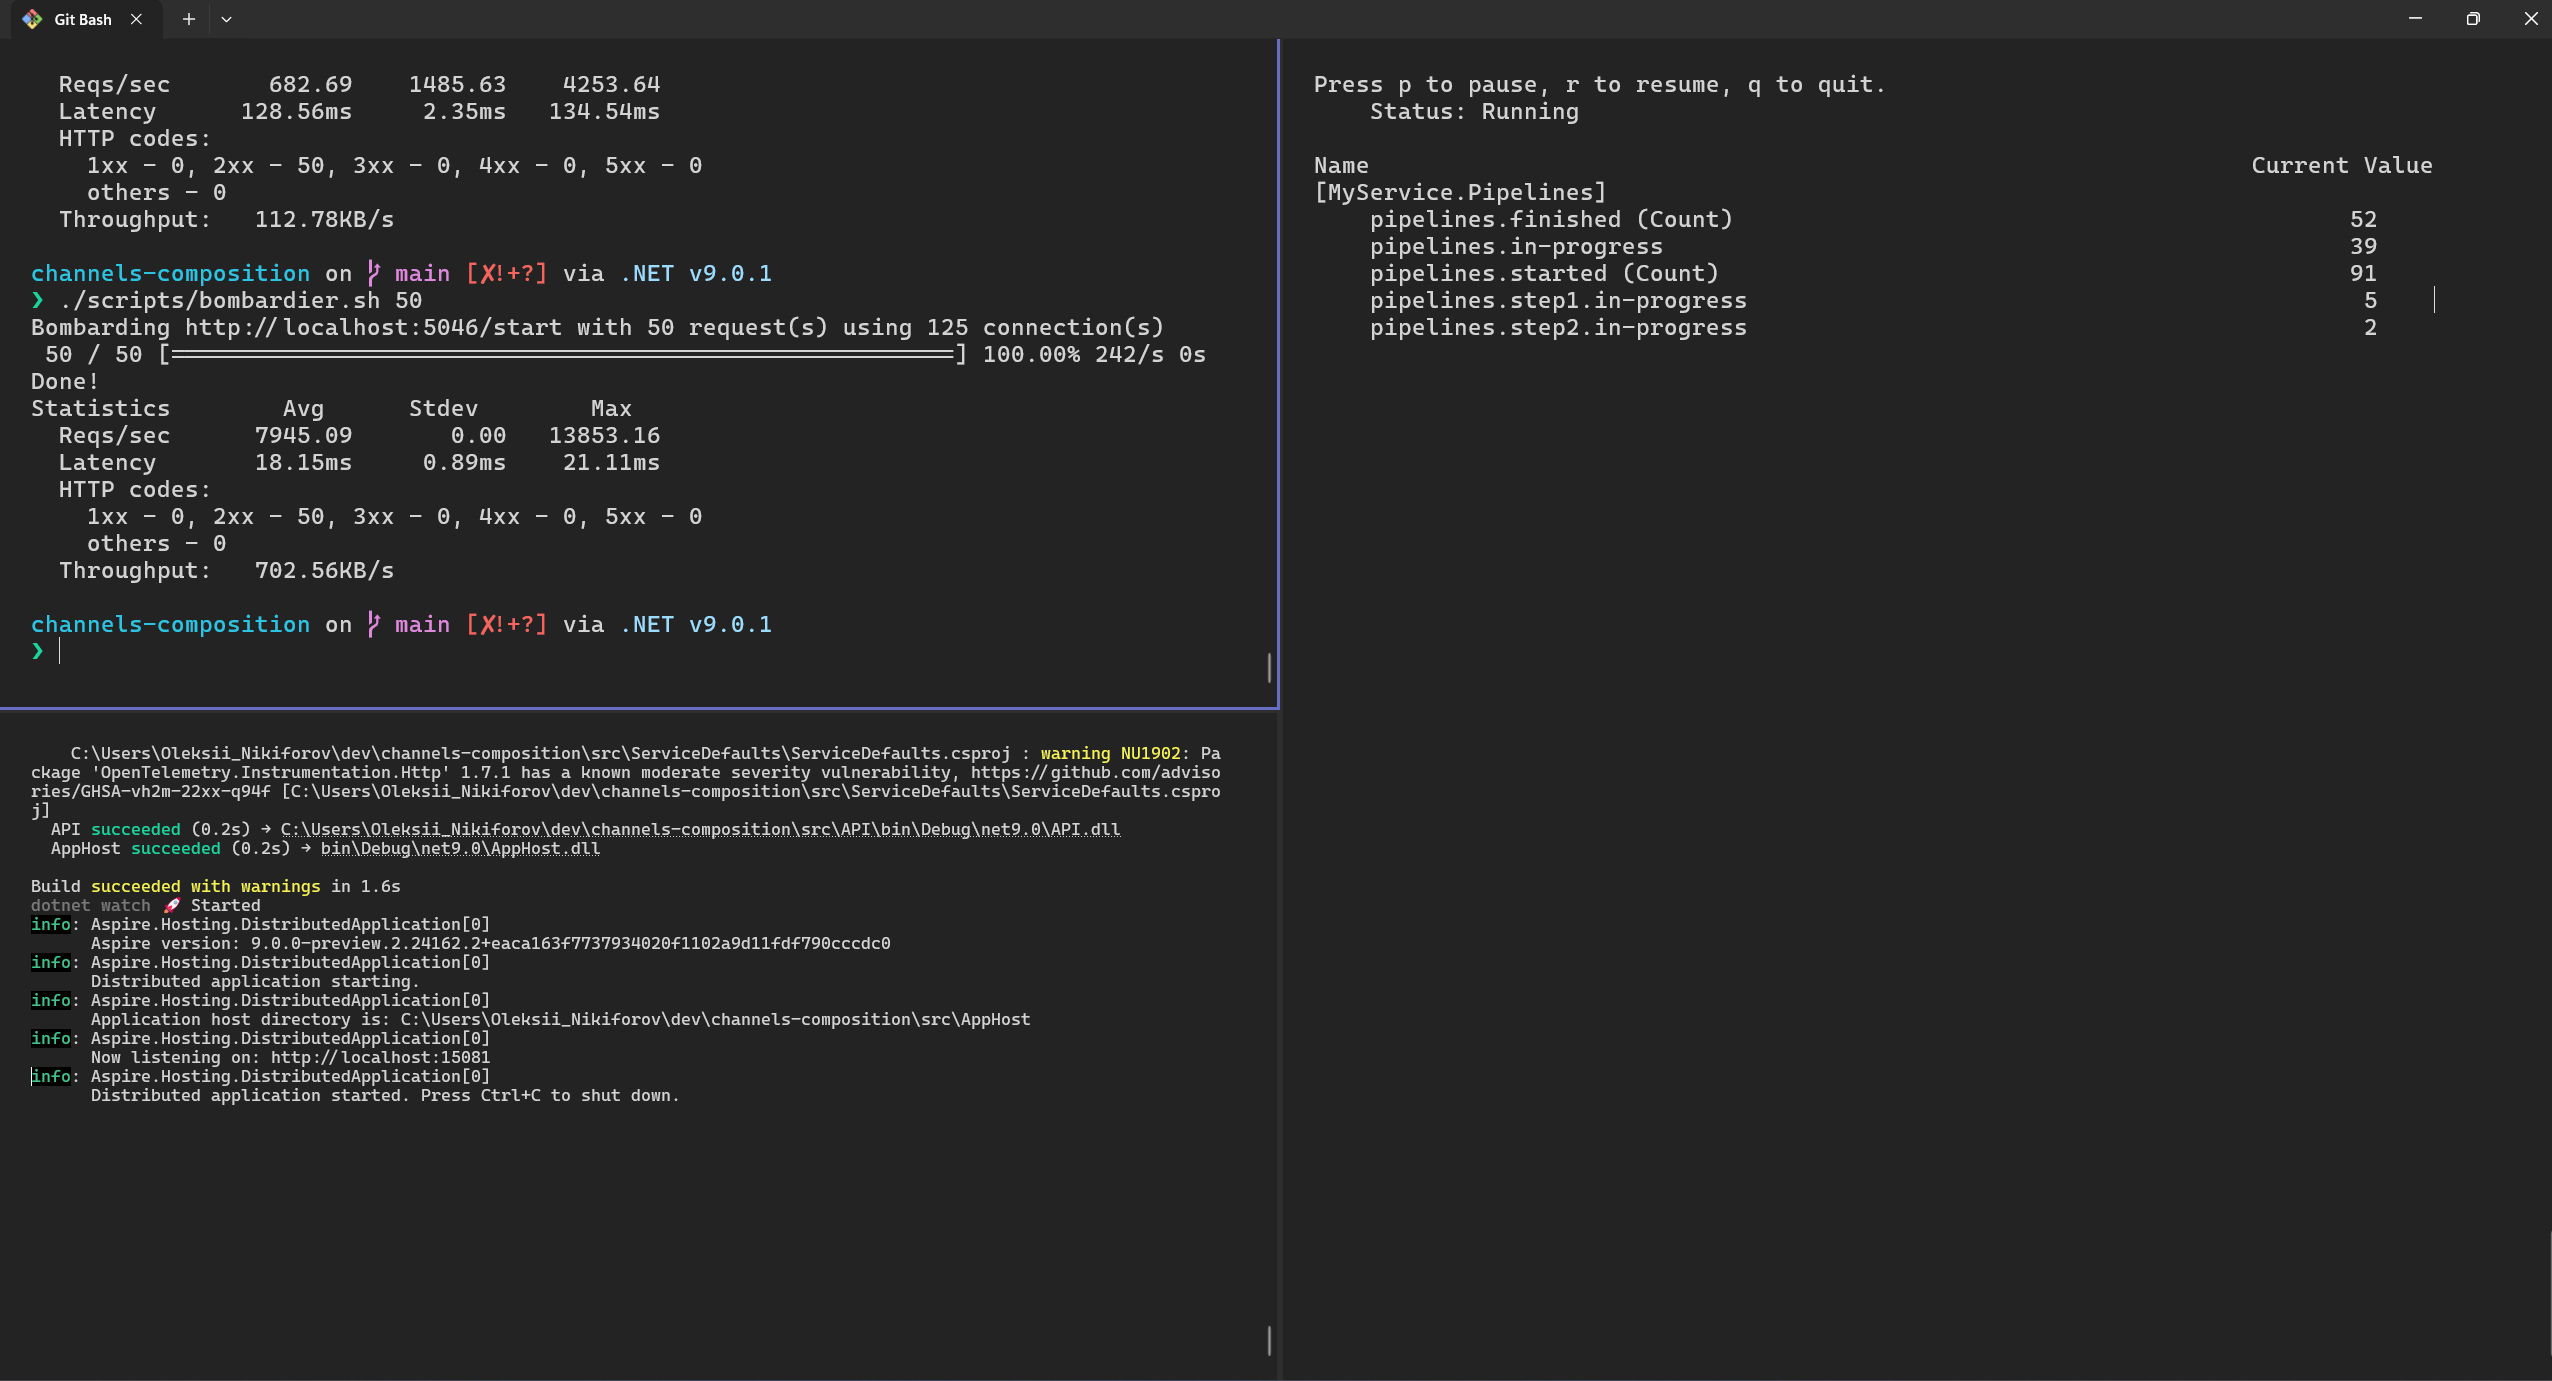
Here is how to inspect the metrics during the runtime (see the results in demo below):
dotnet-counters monitor -n API --counters MyService.Pipelines
Bombardier is a powerful HTTP load testing tool. It’s a command-line utility that allows you to generate high volumes of HTTP traffic to test the performance and scalability of your web services. Here’s how you can use it:
#!/bin/bash

url="http://localhost:5046/start"
requests=${1:-50}

# Invoke bombardier with additional options
bombardier -m POST -H 'Content-Type: application/json' -b '{"name": "Task"}' -n $requests $url
Running multiple requests
Here is an example of making additional 50 simultaneous requests via Bombardier (the image below also contains the result of previous 50 requests run). Note, on the right side we have dotnet-counters launched, it allows us to see the MyService.Pipelines metrics.
./scripts/bombardier.sh 50
Also, I’ve changed the way we collect traces for the demo (using ProcessorChannelSettings.UseUnifiedSpanForAllPipelines=true parameter), the traces are collected under ProcessorBackgroundService root Span for visualization purposes. Please don’t put huge number of traces under one Span in production scenarios.
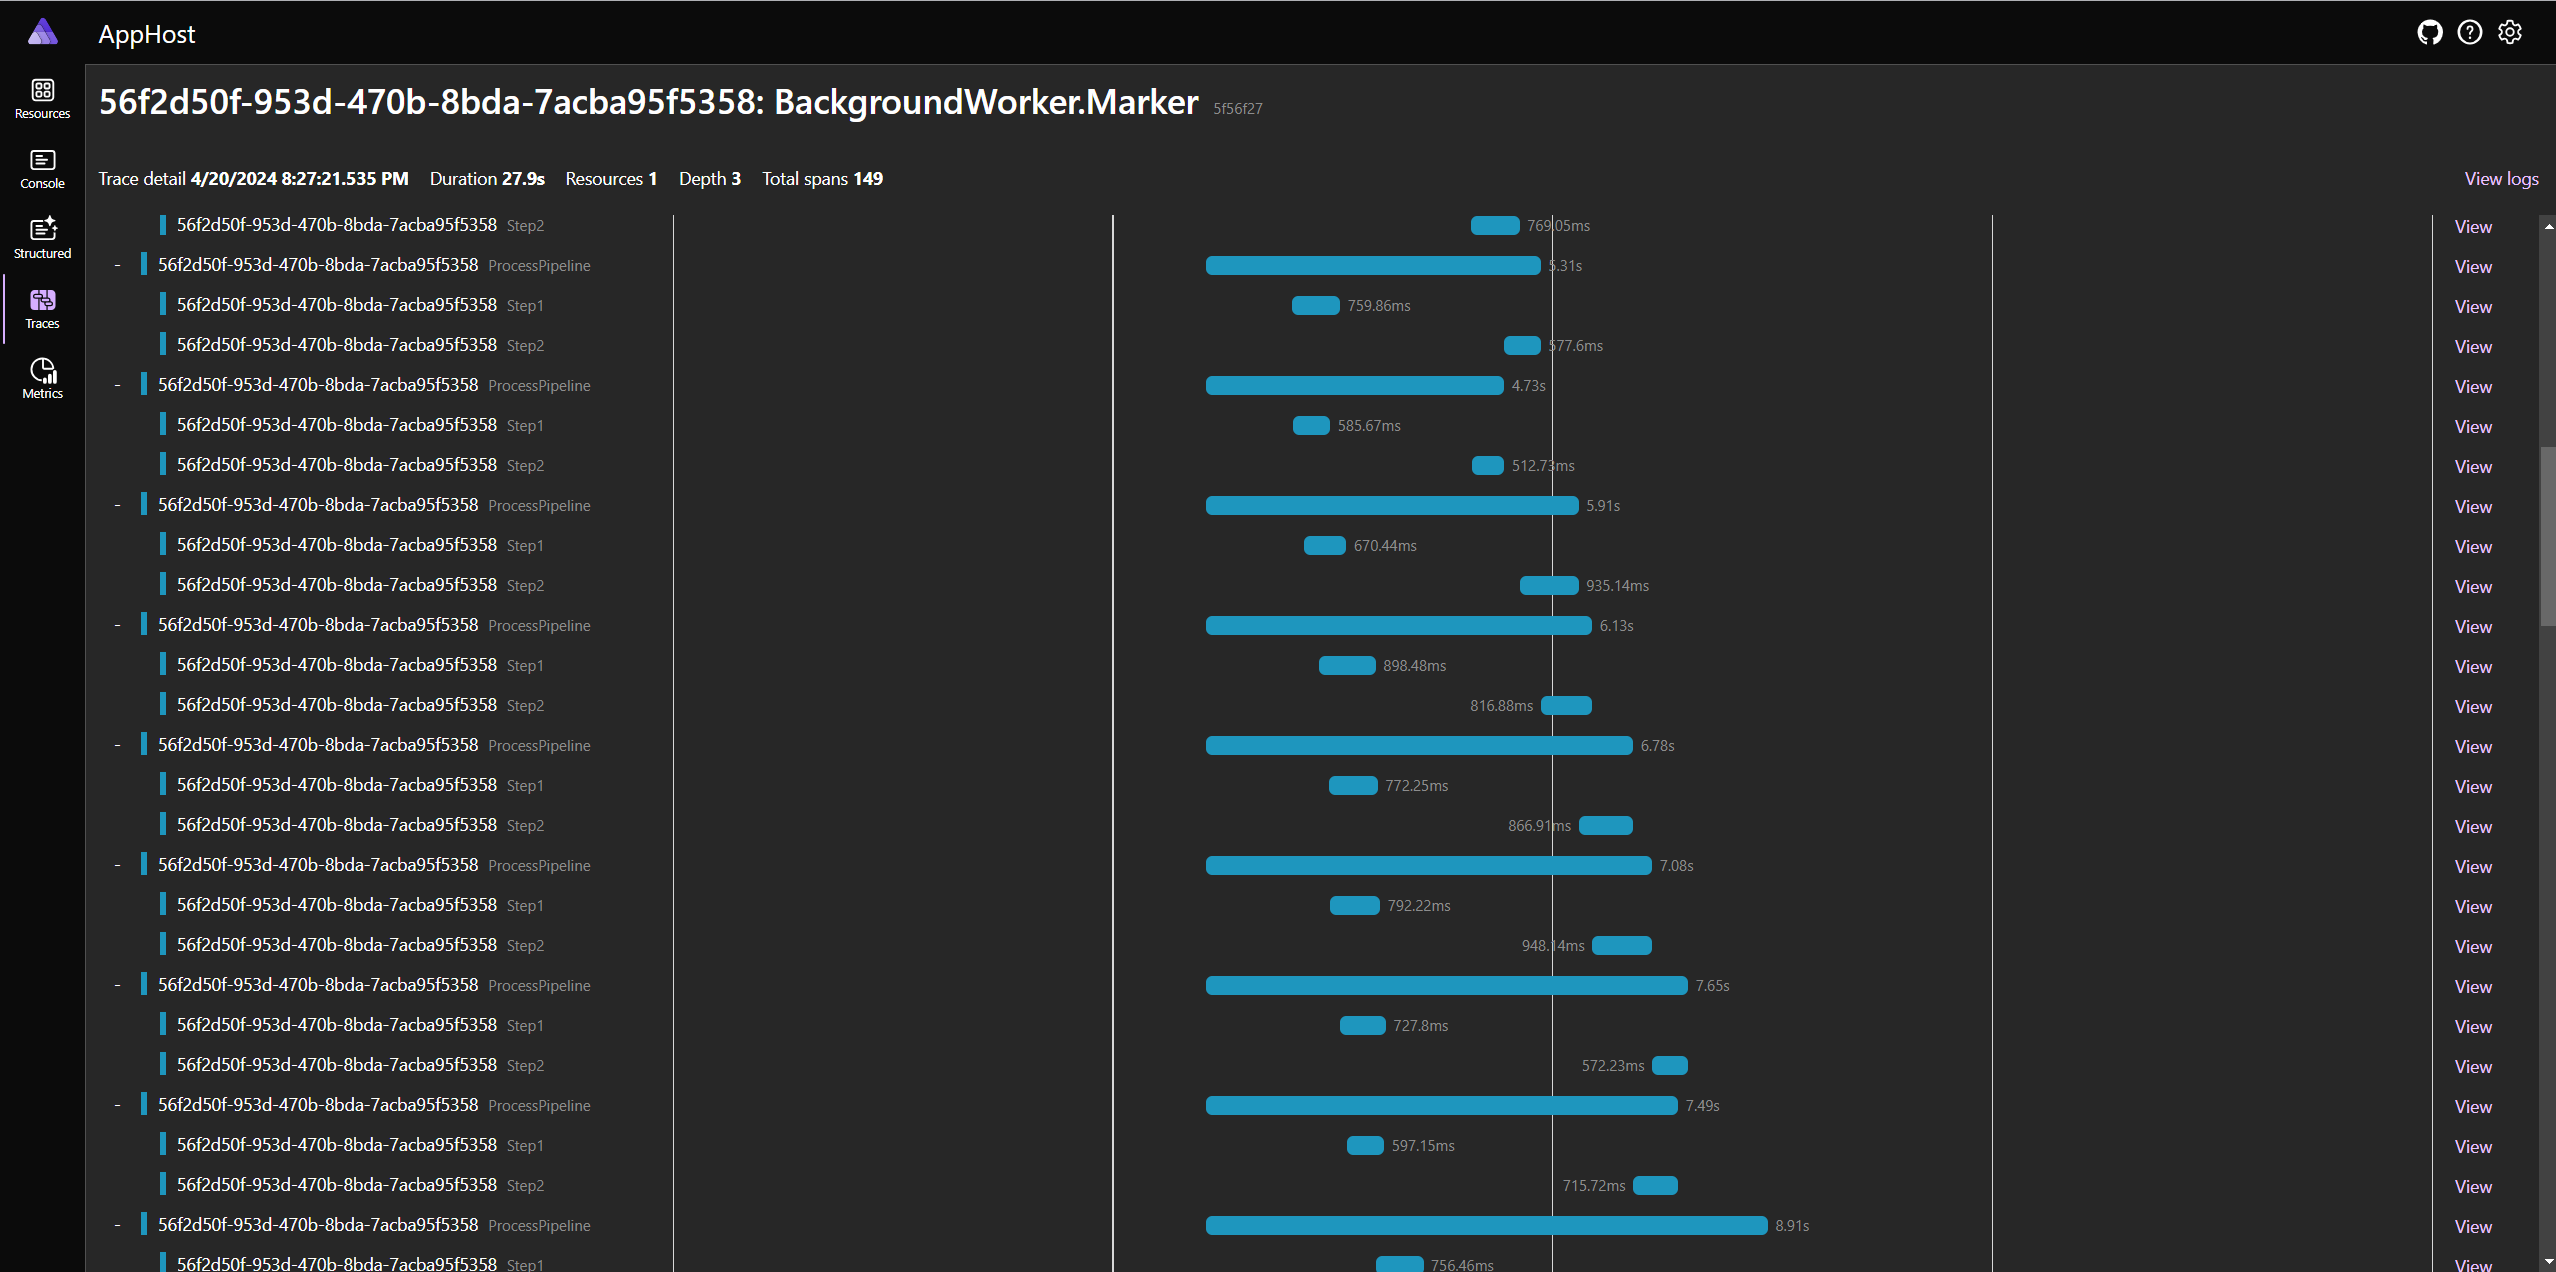
In the image above, we can see how items are concurrently processed by the pipeline. It is interesting how various settings can impact the way our pipeline behaves.
I recommend you to play with it on your own:
public class ProcessorChannelSettings
{
    [Range(1, 100, ErrorMessage = "Capacity must be at least 1")]
    public int Capacity { get; set; }

    [Range(1, 100)]
    public int Step1Capacity { get; set; }

    [Range(1, 10)]
    public int Step1MaxConcurrency { get; set; }

    [Range(1, 100)]
    public int Step2Capacity { get; set; }

    [Range(1, 10)]
    public int Step2MaxConcurrency { get; set; }

    [Range(1, 10)]
    public int MaxConcurrency { get; set; } = 5;

    public bool UseUnifiedSpanForAllPipelines { get; set; }
}
Here is how configuration looks like:
builder.Services.Configure<ProcessorChannelSettings>(options =>
{
    options.Capacity = 25;
    options.Step1Capacity = 10;
    options.Step1MaxConcurrency = 5;
    options.Step2Capacity = 10;
    options.Step2MaxConcurrency = 2;

    options.UseUnifiedSpanForAllPipelines = true;
});
Conclusion
In conclusion, the job offloading pattern is a crucial design pattern in modern software development. It allows for efficient distribution of tasks, leading to improved performance and scalability of applications. By offloading tasks to background services or other systems, the main application thread remains unblocked, ensuring a smooth and responsive user experience.
Moreover, the importance of OpenTelemetry instrumentation cannot be overstated. It provides invaluable insights into the performance and behavior of your applications. With it, you can trace requests as they flow through various components, measure latencies, and gather other critical metrics. This data is essential for identifying bottlenecks, understanding system behavior, and making informed decisions to optimize your applications.
By combining the job offloading pattern with OpenTelemetry instrumentation, you can build robust, scalable, and observable pipelines that can handle high volumes of traffic and deliver superior performance.
References
- https://devblogs.microsoft.com/dotnet/an-introduction-to-system-threading-channels/
- https://github.com/Open-NET-Libraries/Open.ChannelExtensions
- https://blog.maartenballiauw.be/post/2020/08/26/producer-consumer-pipelines-with-system-threading-channels.html
- https://deniskyashif.com/2019/12/08/csharp-channels-part-1/
- https://github.com/martinjt/dotnet-background-otel/tree/main
- https://learn.microsoft.com/en-us/dotnet/core/diagnostics/distributed-tracing-instrumentation-walkthroughs
- https://opentelemetry.io/docs/languages/net/instrumentation/
- https://github.com/open-telemetry/opentelemetry-dotnet/tree/main/examples/MicroserviceExample
- https://learn.microsoft.com/en-us/dotnet/core/diagnostics/metrics-instrumentation
